
|
indicators of briar control |
|
A successful pathway to eradicating Sweet Briars Measurements and analysis by Warren Bond Summary A systematic approach to monitoring and eradicating briars (Sweet Briar, Rosa rubignosa) across the Pinnacle Nature Reserve between 2012 and 2023 has resulted in a consistent decline from an average of 44 briars/ha in the 2012-13 season to an average of 3 briars/ha over the 2019-20 to 2022-23 seasons. Along the way we used a number of indicators to assess our progress. These included: the decline in the number of briars requiring treatment each season, the decline in the density of briars overall as well as at specific hots pots, and the decline in the amount of time and chemical spent controlling briars.
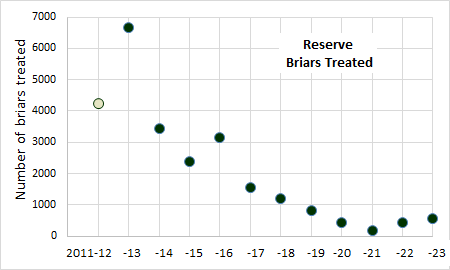
Our Approach to Briar Reduction Since 2011, briar control on the Reserve and neighbouring paddocks (see reserve map) has been carried out primarily by spraying (with the recommended concentration of metasulfuron-methyl). [Some selected cut and dab (with concentrated glyphosate) was trialled in early years but discontinued as being more time consuming and less effective.] Our approach to removing briars, as opposed to the "sweep search" method for spraying more prevalent weeds, has been to collect waypoints of briars and then follow up with spraying those targets. All weeders active on the Reserve collect briar waypoints which are accumulated for several months and then targeted, usually in mid-summer and again in mid-autumn. In later years, as an increasing number of the briars to target were smaller, they were also tagged with flagging tape to make them quicker to locate again. In the follow-up process, other briars are also generally found and sprayed. After the introduction of briar density maps (see below) and the availability of GPS devices on which such maps can be installed (eg the Garmin etrex 20 and 30 series), sweeping of patches mapped as having previously had a high density of briars is also carried out at the time of spraying (regardless of whether any briars were waypointed in those areas since the last spraying). This approach relies in large part on all areas of the Reserve being visited by weeders at least twice a year but does greatly improve the efficiency and effectiveness of spraying briars. Furthermore, because each briar treated is waypointed, maintaining a database of the collected waypoints provides a good means of determining briar distribution and densities and the changes in these from year to year. Waypoints for briars treated in other ways (for example by pulling small ones or by cutting and dabbing larger ones) are also added to the collection. This methodology was gradually developed in the 2011-12 season, but not fully implemented; waypointing was not inclusive, searching not as careful and not all briars were waypointed when sprayed. Treatment was applied consistently on the Reserve from 2012-13 onwards. For this reason, all the indicators of briar control show an increase between 2011-12 and 2012-13, and the 2011-12 values are not included in most of the discussions of indicators below. Briar treatment was started later in the neighbouring paddocks, and treatment has not been as thorough in all years as on the Reserve. Note that the average size of briars treated each season (based on qualitative observation) declined considerably over the years, from something in excess of thigh height in 2011-12 to less than calf height from 2016-17. A large percentage of briars sprayed in recent years have been less than 200 mm high. Briar Numbers
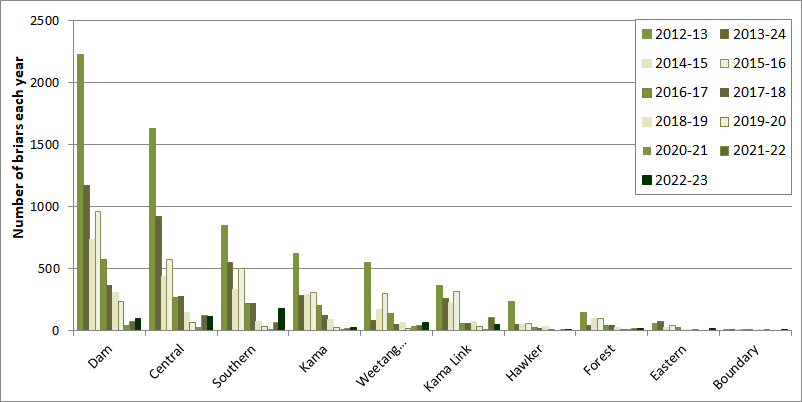
Between 2011 and 2023 more than 25,000 briars have been removed from the Reserve, more than 43% of them in the first 2 seasons. Since 2012 the average density of briars removed across the Reserve has decreased from 44 per hectare to an average over the past 4 seasons of 3 per hectare. The change in numbers for each management unit, or paddock, are shown below.
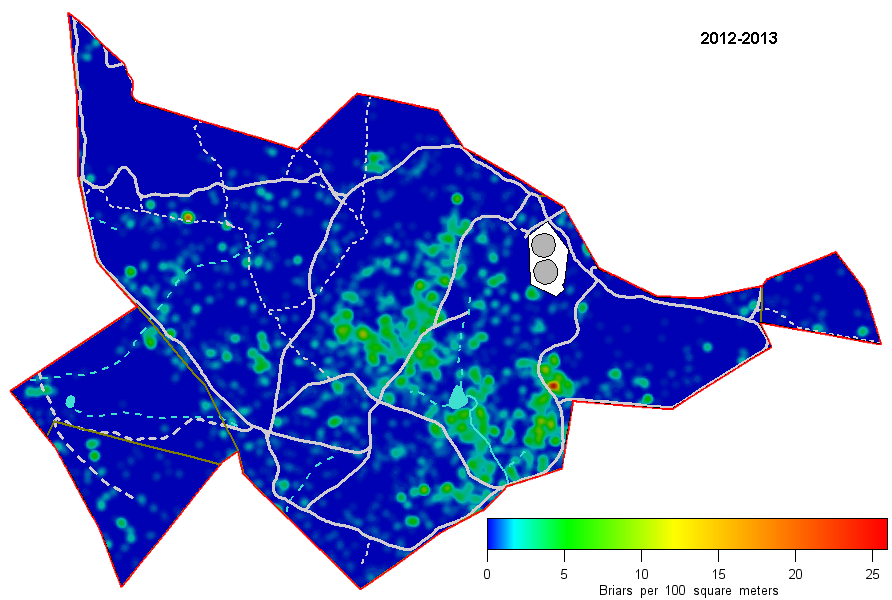
As expected from the totals, the numbers in most paddocks show a downward trend in numbers. It can be seen that not all paddocks experienced an increase in numbers in 2015-16. Those that did have large increases (Dam, Central, Southern, Weetangera and Kama Link) contained most of the densest areas of briars (see below) and therefore the largest seed bank. Kama Link is also adjacent to areas that have received minimal briar control (notably along the William Hovell Drive verge) and so a large source of seeds. This pattern was repeated in 2021-22 and/or 2022-23. The density version of the above chart shows that by 2018-19 the density in all but one paddock (Dam) was 7 briars/ha or less and by 2021-22 the density in all paddocks was 6 briars/ha or less. It is also notable that after 4 seasons of values between 13 and 21, the density of briars in Kama Link paddock declined dramatically in 2016-17, hovering at an average of 3 briars/ha for 5 seasons before doubling to 6 briars/ha in 2021-22. In Hawker paddock a large decline occurred in 2012-13 and took the density to below 5 briars/ha where it has remained since. Briar density distribution maps As mentioned above, all briars are given a geographic location (geo-referenced); GIS software is used to calculate briar density maps from the waypoints. The density analysis calculates the number of briars per 100 square meter circular area around each briar waypoint and then combines and colour-shades the densities as shown in the images below. The base area of 100 square meters was chosen because it approximates the notional worst-case GPS error of ±5 meters (a 100 square meter circle has a radius of 5.64 m). A collection of briar density maps for different individual seasons and sets of accumulated seasons can be found on the briar density page. Just two are presented here to indicate progress in controlling briars between 2012-13 and 2022-23.
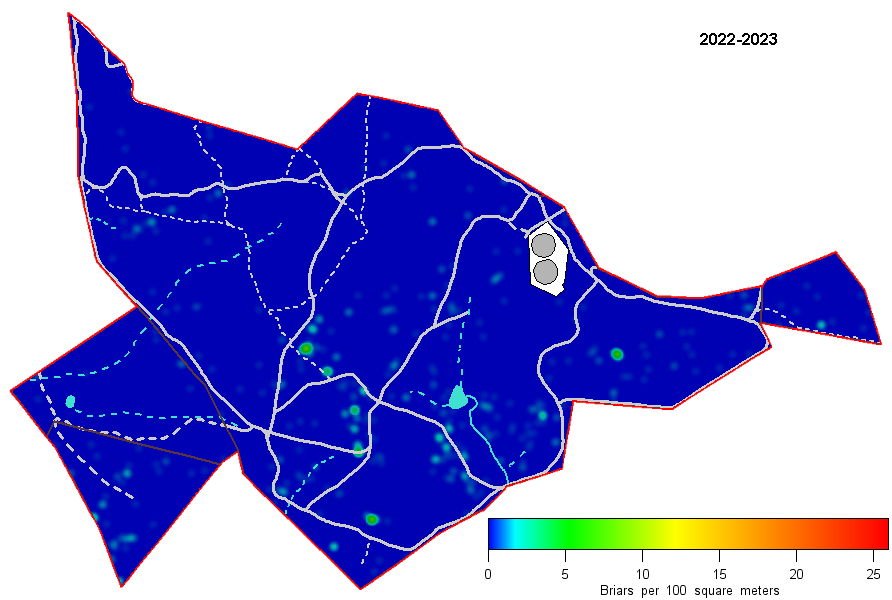
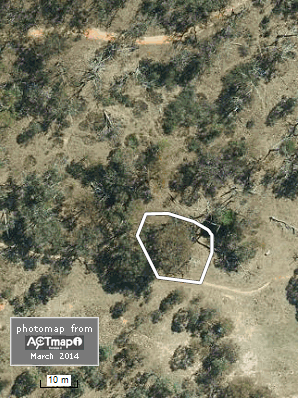
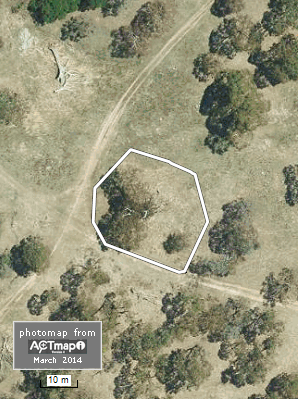
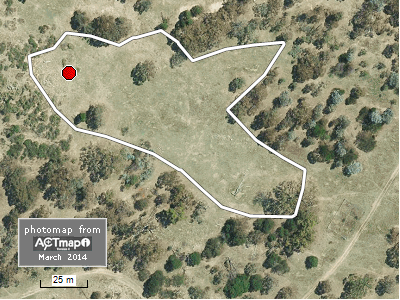
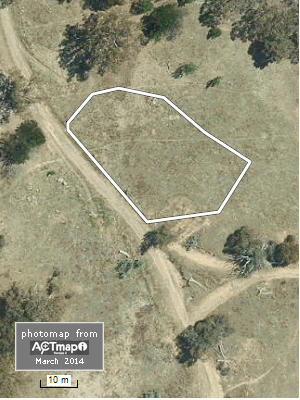
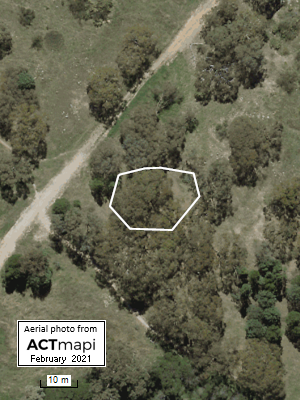
These images show that the overall density has declined considerably, in keeping with the decline in total numbers. In 2012-13 the maximum spot density observed in the Reserve was 25 per 100 square meters, whereas in 2020-21 it was less than 1.6 per 100 square meters. This trend was broken in 2021-22 by a new patch with a maximum density of 19 briars per 100 square meters, as described below. In 2022-23 the maximum spot density was 9 briars per 100 square meters Nevertheless, average density across the whole Reserve has declined from 44 briars/ha in 2012-13 to an average over the 2019-20 to 2022-23 seasons of 3 briars/ha. The images on the briar density page also show that the basic distribution pattern remained more or less the same up to the 2015-16 season but with the areas of high density in 2012-13 becoming much less dense and contracting in size. Many of the dense areas in 2012-13 had disappeared by 2020-21 and since then the areas of highest density each season are largely unrelated to those in 2012-13. These observations are also demonstrated below through examples of the change over time in briar numbers at several density hotspots. Although briar control has also been occurring to some extent in the neighbouring paddocks, briar density maps are presented here only for the Reserve where, because it has taken priority, coverage has been more complete. A density map for the whole area may be found at the bottom of the briar density page. This allows a comparison of briar densities in Bottom Pinnacle and North Kama with those on the Reserve. It may be seen from this map that briar densities are much less in the neighbouring paddocks. One factor affecting this is suspected to be cattle grazing. The density of briars increases as the time without grazing increases (from North Kama to Bottom Pinnacle to the Reserve). The two northern paddocks of North Kama have a lower density that the southern North Kama paddock (now the extension), which is also ungrazed but has been for less time than Bottom Pinnacle. This observation is consistent with cattle indiscriminately removing small briar seedlings in their grazing. The density differences could also be associated with the tree density, which varies in the same way. In many instances dense briar patches are associated with trees. The densest patch that has existed on the Reserve, however, has no trees whatsover and judging from historical aerial photos hasn't had trees for at least 80 years. Analysis of briar numbers in specific high density areas Inspection of the cumulative briar density map ( 2011 - 2023) and comparison with aerial photos shows that high density areas can occur in two very different kinds of locations: around specific trees and in areas devoid of trees. This section shows two examples of each (patches 1 to 4) where high briar densities were found in the first two seasons of monitoring showing the change in briar numbers since then. Patch 5 is a high density patch that appeared in 2021-22, illustrating the need to remain vigilant across the whole Reserve even if overall numbers are decreasing. 1. A tree on the edge of the Forest paddock
2. A tree at the track crossroads west of the dam
3. The bare area downslope of the rabbit-infested rocky outcrop in the Central paddock
4. The south-west corner of Weetangera paddock
5. Trees west of the rabbit-infested rocky outcrop in the Central paddock
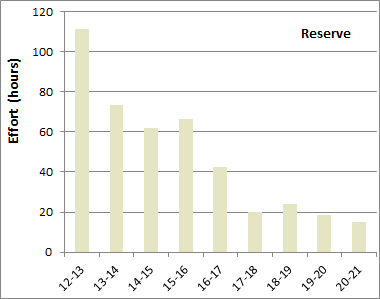
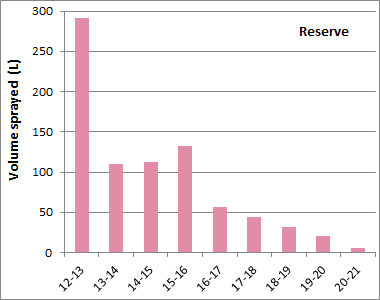
Other Indicators For the first few years of control, other indicators that provided evidence of progress included the effort and volume of chemical sprayed required for control each season and the quantity of briar hips removed each season. These have now been discontinued because as briar numbers become fewer both effort and volume of chemical required become less reliable indicators, as discussed below, and because there are now not enough hips removed each season to make it worthwhile monitoring. Time taken and volume of spray used Two other useful indicators of the long-term trend in weed control are the time spent and the amount of chemical spray mixture used on particular weeds in particular areas. These are shown below for Briars on the Reserve. Both show a significant decline from 2012 to 2021, consistent with the data showing the decline in numbers. Note that volume sprayed correlates more closely with briar numbers than effort. There was a 48-fold decrease in volume used between 2012-13 and 2020-21 compared with a 40-fold decrease in briar numbers and only a 7-fold decrease in time spent. The poor correlation with effort arises because as the density of briars decreases from season to season more time is spent walking between briars, so the effort reaches a point where it doesn't decrease very much with a decrease in numbers. The volume of spray used was a good surrogate for briar numbers in assessing the extent of briar reduction. It should be noted, however, that all spraying was done by the same person applying a similar amount of spray commensurate with briar size; spraying by multiple sprayers, particularly different sprayers in different seasons, may not provide such a reliable correlation. By 2020-21 the volume of chemical used was so small as to be difficult to measure reliably.
Annual effort (left) and chemical volume (right) expended on spraying Briars on the Reserve.
Hip collection While there is no quantitative data to support this, the number of briars reaching the mature hip stage on the Reserve has drastically reduced over the period that treatment has been intense. In the first two seasons of spraying briars, several kilograms of hips were collected each season, whereas since 2014-15 there have been no more than several handfuls collected. Thus, the briar reduction program is probably having a greater effect on the ability of briars to increase the seed bank and reproduce than on overall numbers. For a weed with a quoted seed longevity in the soil of ~ 5 years, this was a useful early sign that a long term impact was likely being made.
|
||||||||||||||||||||||||||||||||||||||||||||||||||||||||||||||||||||||||||||||||||||||||||||||||||||||||||||||||||||||||||||||||||||||||||
© Friends of The Pinnacle