
|
weeding maps |
|
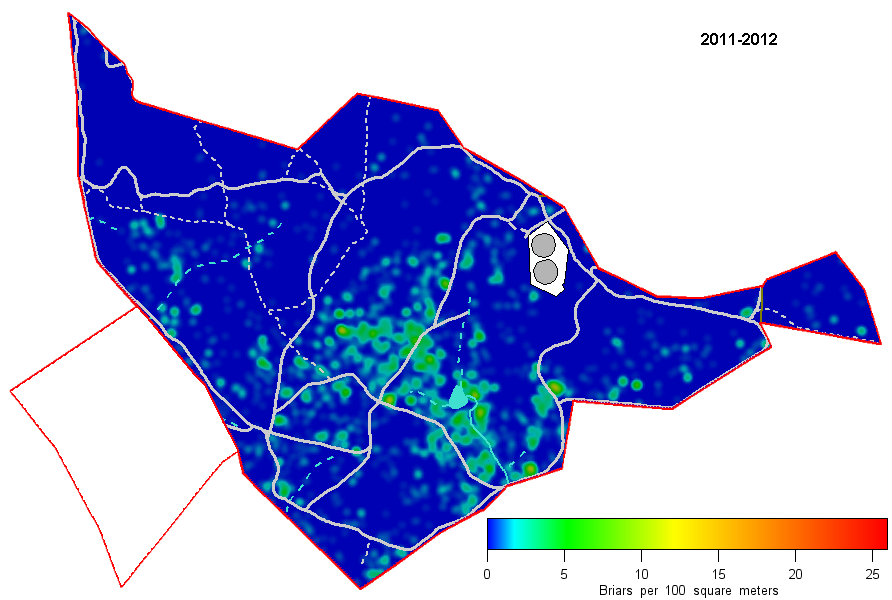
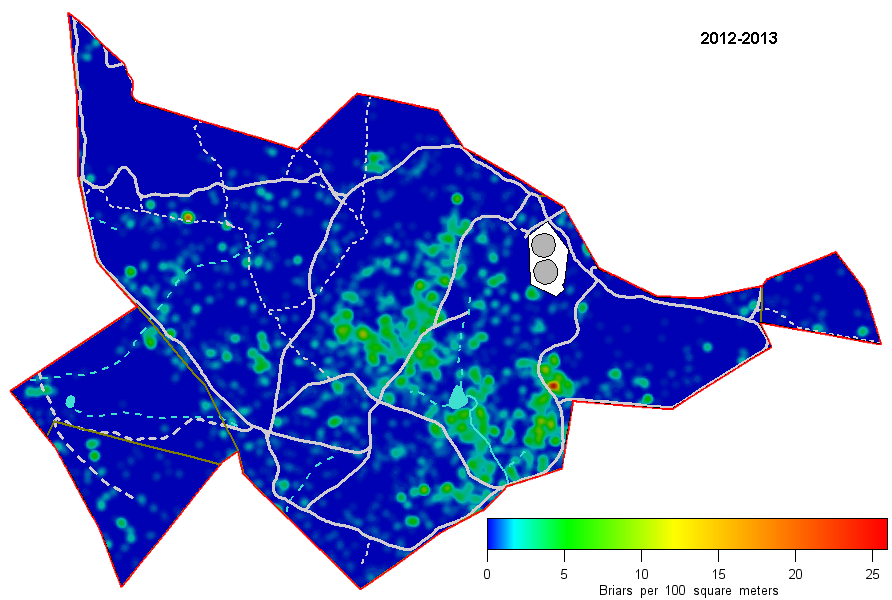
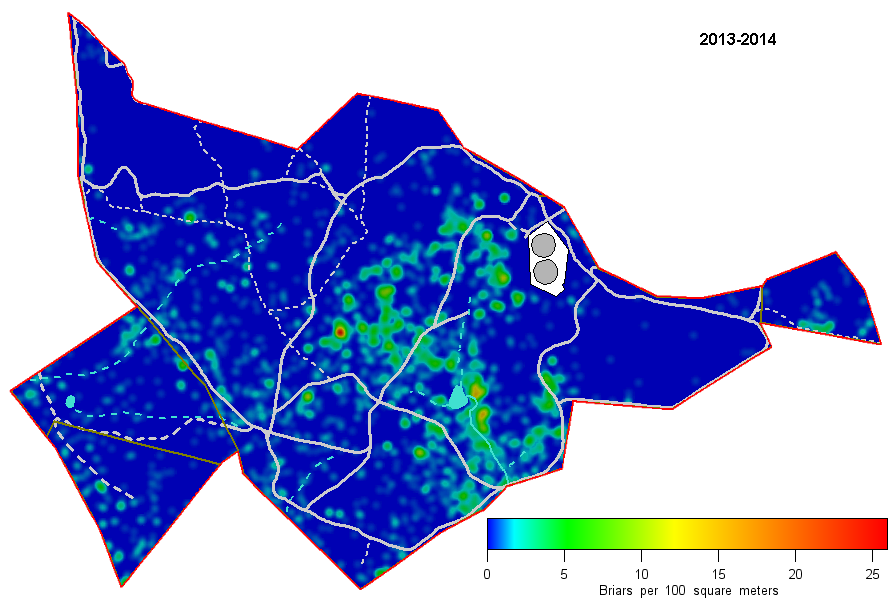
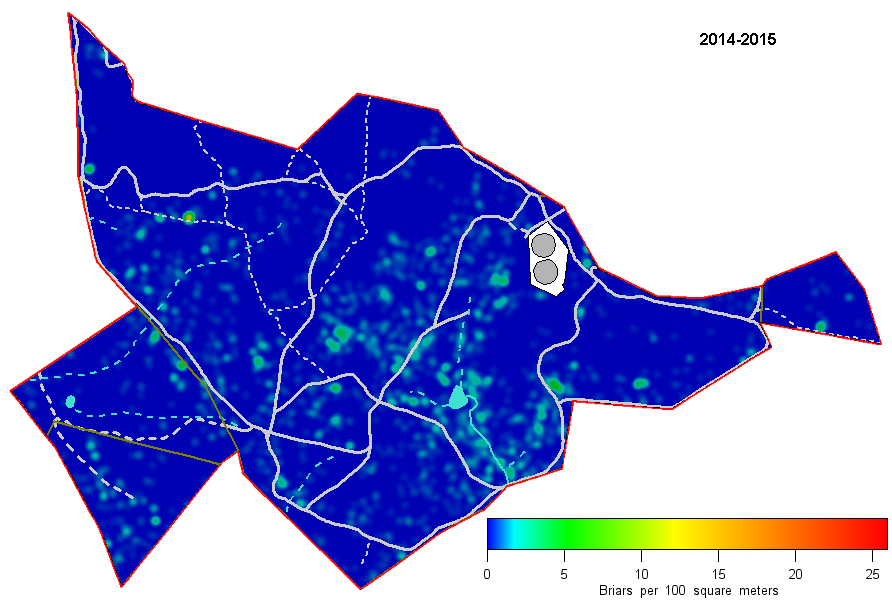
Briar Density Distributions on The Reserve and their response over time to our briar eradication program
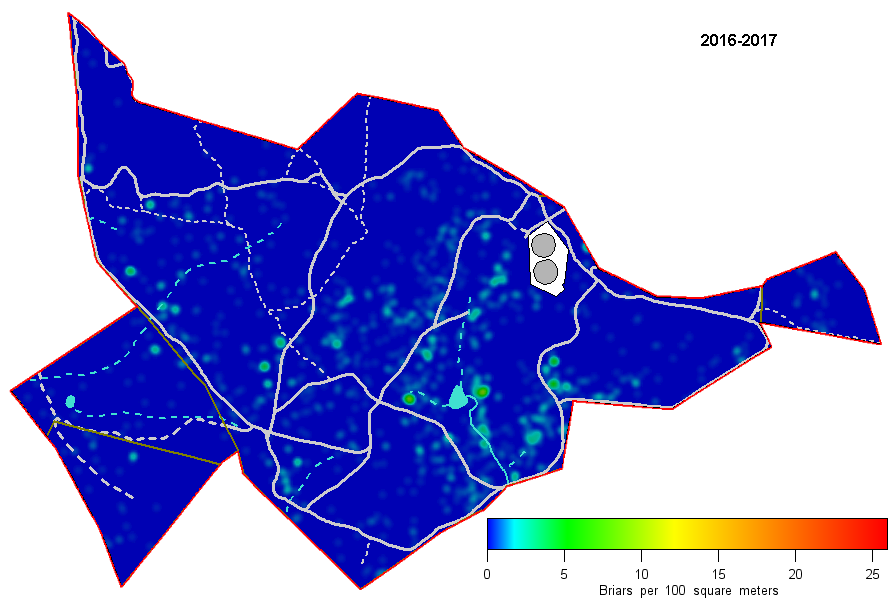
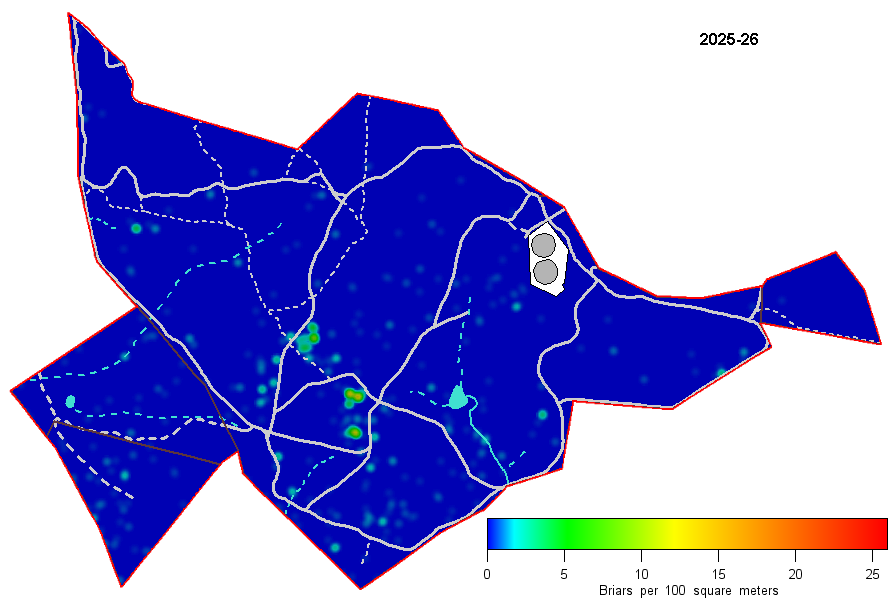
Quick Comparison (click on any small map to go to a larger version below)
Note that treatment of briars did not commence in the area that became the Pinnacle Extension until 2012
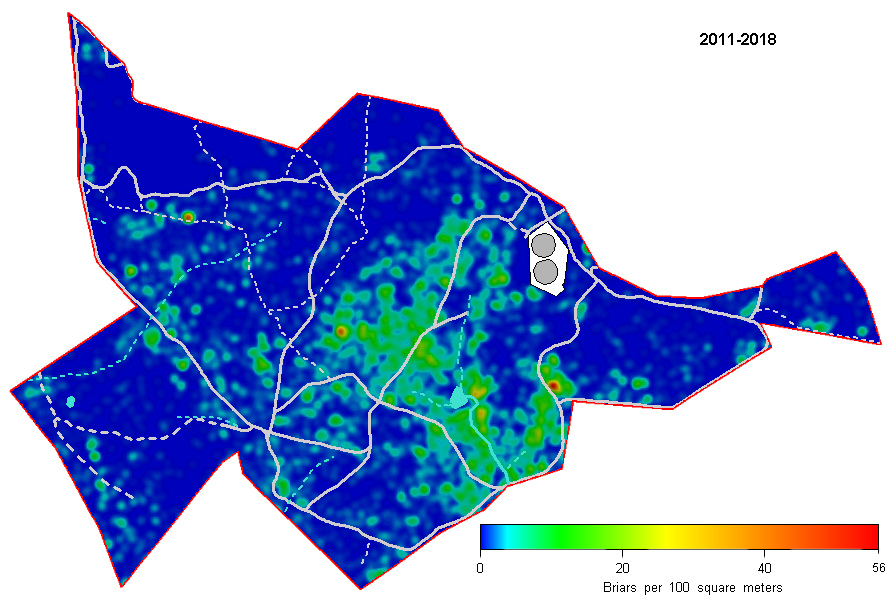
Cumulative Briar Densities across the Reserve July 2011 to June 2018
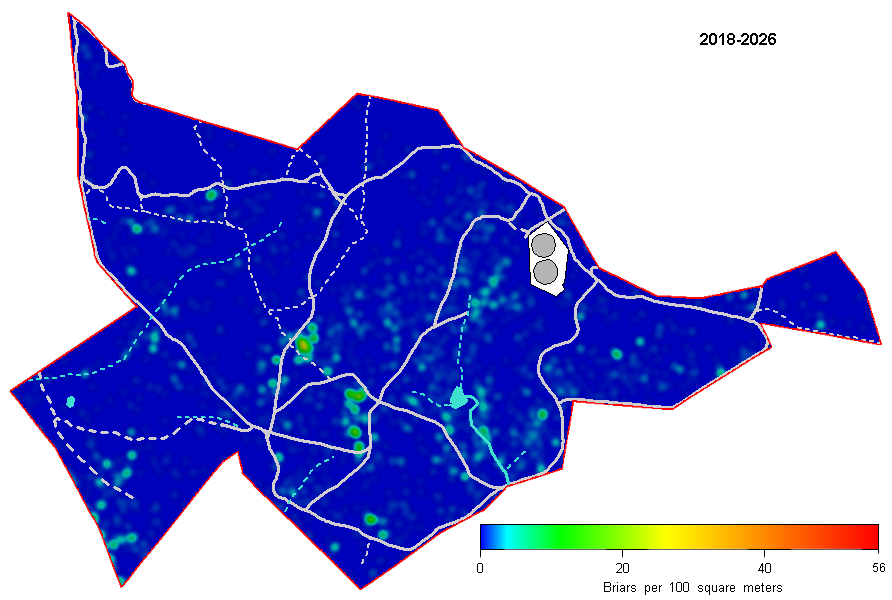
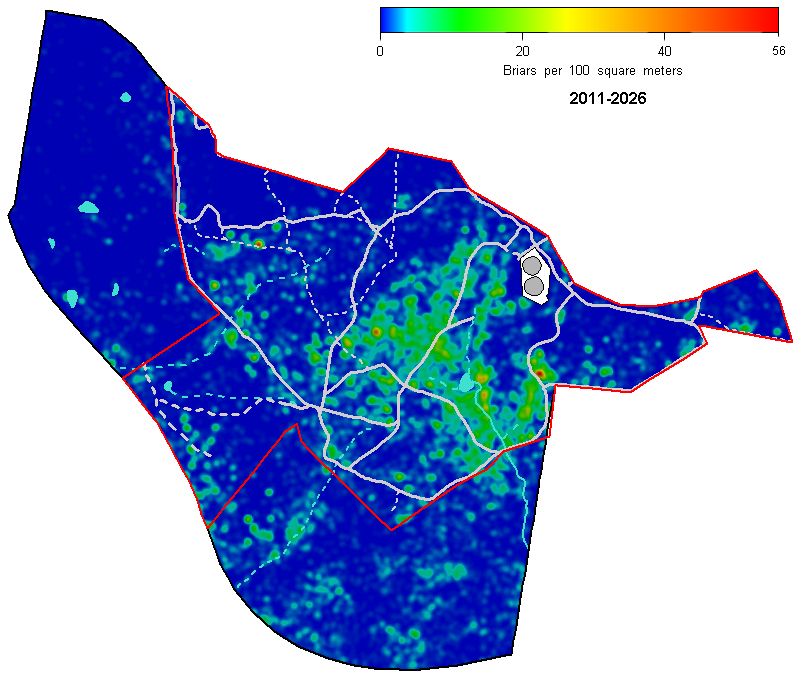
Cumulative Briar Densities across the Reserve July 2018 to June 2026
Cumulative Briar Densities across the Reserve, Bottom Pinnacle and North Kama July 2011 to June 2026
fotpin's approach to briar eradication Since 2011, briar control on the Reserve and neighbouring paddocks has been carried out largely by spraying (with the recommended concentration of metasulfuron-methyl), with some selected cut and dab from time to time (with concentrated glyphosate). Our approach to briars, as opposed to the "sweep search and destroy" spraying of more prevalent weeds, has been to collect waypoints of briars and then follow up with spraying those targets. All weeders active on the Reserve collect briar waypoints which are accumulated for several months and then targeted. In the process of targeting, other briars are also identified and sprayed. Since the refinement of the briar density maps above and the implementation of GPS devices on which such maps can be installed (eg the Garmin etrex 20 and 30 series), sweeping of denser patches is also carried out at the time of spraying (regardless of any previously identified briars in those areas). This approach greatly improved the efficiency of spraying. Furthermore, because each briar treated is waypointed, maintaining a spatial database the collected waypoints provides a good means of determining briar distribution and densities and the changes in these from year to year. Waypoints for briars treated in other ways (for example by pulling small ones or by cutting and daubing larger ones) are also added to the collection. This methodology was gradually developed in the 2011-12 season, but not fully implemented; waypointing was not inclusive, searching not as careful and not all briars were waypointed when sprayed. Treatment was applied consistently on the Reserve, including the area that was to become the Extension) from 2012-13 onwards. For this reason, density maps show an increase between 2011-12 and 2012-13. Briar treatment was started later in the neighbouring paddocks, and treatment has not been as thorough in all years as on the Reserve, so the data is a less reliable indication of the briar density in North Kama and Bottom Pinnacle.
|
|||||||||||||||||||||||||||||||||||||||||||||||||||||||||||||||||


© Friends of The Pinnacle