
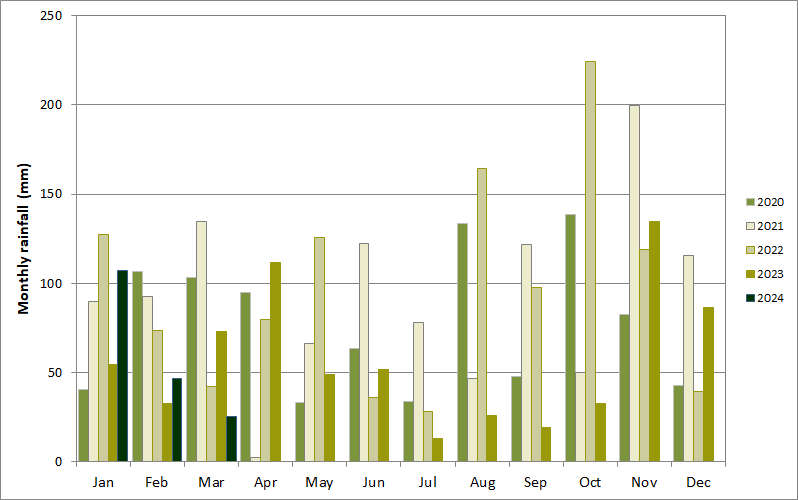
Monthly rainfall history for the Pinnacle
| Year | Jan | Feb | Mar | Apr | May | Jun | Jul | Aug | Sep | Oct | Nov | Dec | Total |
| 2026 | 13 (3) |
73 (7) |
105 (7) |
14 (2) |
78 (7) |
57 (8) |
341 (34) |
||||||
| 2025 | 49 (7) |
68 (7) |
53 (5) |
21 (4) |
58 (5) |
48 (7) |
80 (9) |
33 (6) |
68 (5) |
19 (5) |
36 (7) |
42 (4) |
574 (71) |
| 2024 | 107 (9) |
47 (6) |
25 (2) |
93 (5) |
41 (4) |
40 (10) |
23 (4) |
18 (6) |
21 (3) |
32 (4) |
43 (3) |
77 (6) |
566 (62) |
| 2023 | 55 (6) |
33 (6) |
73 (8) |
112 (8) |
49 (4) |
52 (9) |
13 (3) |
26 (6) |
19 (1) |
33 (3) |
135 (5) |
87 (11) |
684 (70) |
| 2022 | 127 (10) |
74 (5) |
42 (8) |
80 (2) |
126 (8) |
36 (6) |
28 (5) |
164 (14) |
98 (13) |
224 (14) |
119 (9) |
39 (5) |
1156 (105) |
| 2021 | 90 (11) |
92 (7) |
135 10) |
2 (1) |
66 (6) |
122 (10) |
78 (15) |
47 (7) |
122 (8) |
50 (8) |
200 (14) |
116 (11) |
1119 (108) |
| 2020 | 40 (5) |
106 (6) |
103 (7) |
95 (8) |
33 (6) |
63 (5) |
32 (6) |
133 (12) |
48 (6) |
139 (13) |
83 (11) |
42 (6) |
917 (88) |
| 2019 | 67 (10) |
41 (5) |
67 (7) |
20 (1) |
55 (9) |
20 (5) |
10 (4) |
25 (6) |
32 (3) |
21 (4) |
16 (1) |
2 (1) |
375 (57) |
| 2018 | 46 (7) |
98 (2) |
6 (2) |
20 (4) |
20 (5) |
33 (10) |
8 (3) |
47 (5) |
22 (1) |
16 (4) |
94 (10) |
116 (9) |
526 (62) |
| 2017 | 14 (3) |
20 (5) |
98 (12) |
42 (6) |
56 (3) |
1 (0) |
22 (7) |
58 (9) |
19 (4) |
64 (7) |
77 (9) |
120 (10) |
589 (75) |
| 2016 | 107 (10) |
44 (4) |
41 (7) |
8 (3) |
68 (8) |
151 (12) |
100 (14) |
53 (7) |
180 (12) |
47 (10) |
79 (7) |
54 (5) |
932 (99) |
| 2015 | 105 (8) |
16 (6) |
13 (3) |
103 (10) |
15 (3) |
81 (4) |
44 (7) |
76 (8) |
16 (4) |
21 (5) |
84 (7) |
35 (3) |
610 (68) |
| 2014 | 9 (1) |
105 (7) |
78 (10) |
84 (7) |
22 (3) |
69 (10) |
26 (4) |
41 (4) |
39 (5) |
52 (4) |
31 (4) |
110 (10) |
664 (69) |
| 2013 | 65 (4) |
70 (8) |
33 (4) |
14 (3) |
13 (3) |
89 (7) |
52 (8) |
30 (8) |
76 (4) |
17 (5) |
90 (6) |
20 (3) |
572 (63) |
| 2012 | 67 (7) |
152 (13) |
263 (10) |
29 (5) |
31 (3) |
44 (5) |
45 (5) |
44 (5) |
47 (5) |
53 (3) |
33 (3) |
38 (5) |
845 (71) |
| 2011 | 60 (7) |
147 (8) |
49 (8) |
11 (3) |
21 (3) |
12 (2) |
40 (8) |
61 (5) |
40 (6) |
32 (8) |
144 (9) |
63 (10) |
680 (77) |
| 2010 | 4 (2) |
159 (8) |
91 (7) |
26 (3) |
78 (7) |
32 (4) |
71 (7) |
86 (9) |
91 (5) |
116 (7) |
160 (9) |
176 (11) |
1089 (79) |
| Jan | Feb | Mar | Apr | May | Jun | Jul | Aug | Sep | Oct | Nov | Dec | Annual | |
| Mean | 62 |
59 | 57 | 48 | 44 | 48 | 48 | 54 | 59 | 60 | 73 | 58 | 669 |
| Median | 48 | 46 | 43 | 35 | 39 | 42 | 42 | 48 | 57 | 48 | 76 | 46 | 646 |
| Jan | Feb | Mar | Apr | May | Jun | Jul | Aug | Sep | Oct | Nov | Dec | Annual | |
| Mean | 59 |
56 | 51 | 46 | 44 | 40 | 41 | 46 | 52 | 62 | 64 | 54 | 616 |
| Median | 49 | 55 | 32 | 30 | 38 | 31 | 36 | 46 | 52 | 55 | 60 | 44 | 617 |
| rainy days | 6 | 5 | 5 | 5 | 5 | 6 | 6 | 7 | 7 | 8 | 8 | 6 |
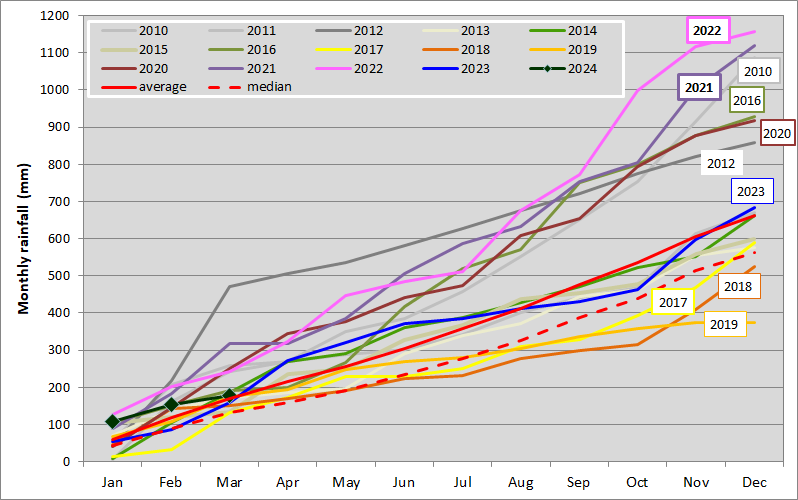
Cumulative rainfall
(allows better comparison between years)
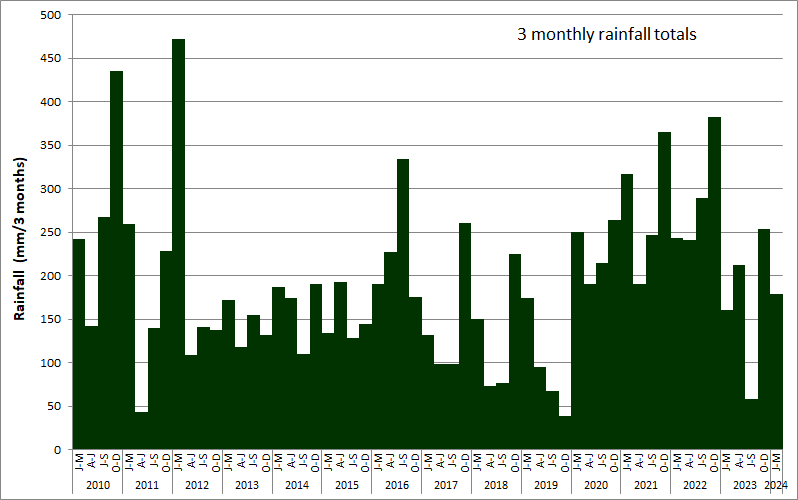
3-month rainfall totals
(allows better comparison between seasons)
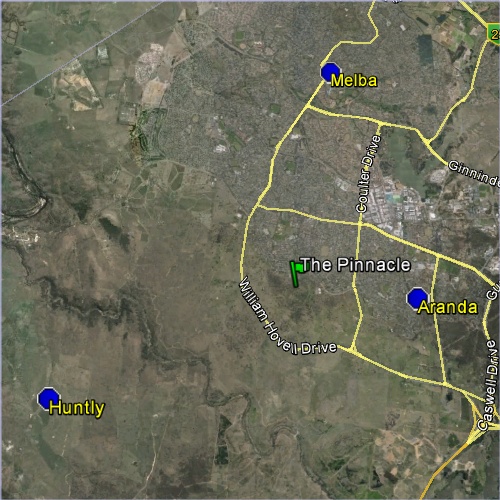
Source of Composite Rainfall Data
The rainfall data summarised in the chart and tables above have been obtained from official Bureau of Meteorology Rainfall stations nearest to The Pinnacle (shown on the map below). Until the end of 2015 all three stations shown were included, but since then two have been discontinued: Huntly at the end of 2015 and Melba in the middle of 2023. Since then only the Aranda station has been able to be used. This means that the applicability to The Pinnacle NR is much reduced, especially the loss of the Huntly station. The Aranda data is occasionally supplemented with data from non-BoM measurement sites along the southern border of Hawker when large discrepancies have been observed and are explainable in terms of the rainfall source and distribution (such as the occurrence of patchy thunderstorms).
| Name | Station No. | Source |
| Aranda | 70242 | Aranda url |