Note: This page has not been optimised for small screens
Most-recent fotpin News
An important aspect of the Weed Management Plan is monitoring and reporting on our interventions. This includes monitoring our weeding effort to know how our resources have been deployed, and to compare it with the requirements projected in the plan and effort in previous years.
Data on this page is for the year 1 July 2016 to 30 June 2017.
Weeding effort for the current season, updated monthly, can be found at weeding effort.
To view data from previous seasons, select the required season from the "Past effort" menu above, then select overview.
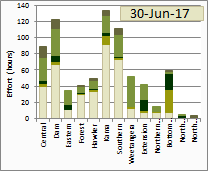
Tip: Hover mouse over chart thumbnail to see full size chart.
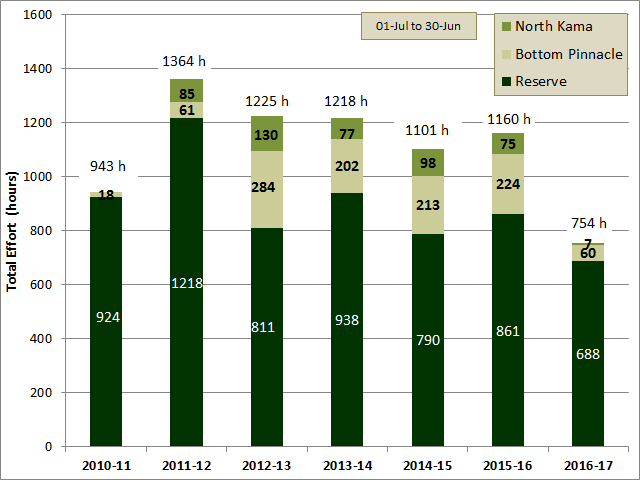
Between 1 July 2016 and 30 June 2017, the total amount of effort deployed in weed management across the Reserve and the neighbouring paddocks was 754 hours. A further 19 hours was spent on experimental grass slashing for weed control. Excluding the experiment effort, this was 35% (406 h) less than last season, and the smallest total for the 7 years of records. The amount of time spent on the Reserve* itself (91% of the total) was only 20% less than last season, but also the smallest on record. This comparatively low effort reflects a large decrease in available volunteer time as well as the effect of the extremely dry summer on weed growth this season.
[*Note: effort for the Reserve includes effort in the Extension, both in this season and in previous seasons.]
Despite the reduced effort, the major target weeds on the Reserve were controlled as effectively as in previous years, in part because effort in adjacent paddocks was reduced and focussed instead on the Reserve and in part because of our ever-improving knowledge of where each weed type is located through our intensive mapping. In addition we are slowly having a measurable, lasting impact on weed infestation.
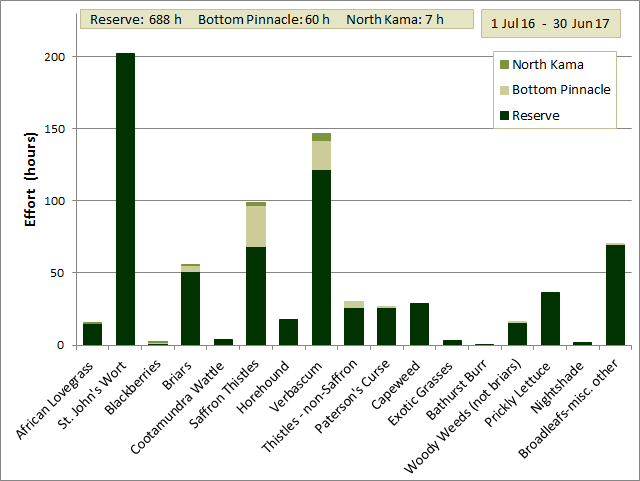
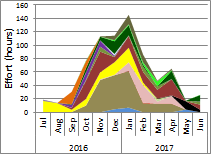
This chart shows the total effort for each weed type and how that was distributed between the Reserve and neighbouring paddocks. The largest effort was spent on St. John's Wort (202 h, all on the Reserve). This was the same as the time spent on the Reserve last season.
The next most effort was for Verbascum (122 h on the Reserve, 146 h total). The effort on the Reserve was 38% less than last season, largely because the rainfall conditions were less conducive to the germination and growth of Verbascum than in the previous season (see Measuring the effectiveness of Verbascum control).
The third most effort for a single weed type was spent on Saffron Thistles (68 h on the Reserve, 99 h total, similar to the previous season). A similar amount of effort was spent on the grouping of miscellaneous Broadleaf Weeds (106 h, all on the Reserve, 23% less than 2015-16).
To see how our effort for each weed type changed through the season, hover over the chart to the left, and/or visit the monthly effort page. Monthly effort for each type can also be compared for the past five seasons by visiting the monthly history page.
For an even more detailed view, and a comparison with last season, visit the weed type
effort over time page.
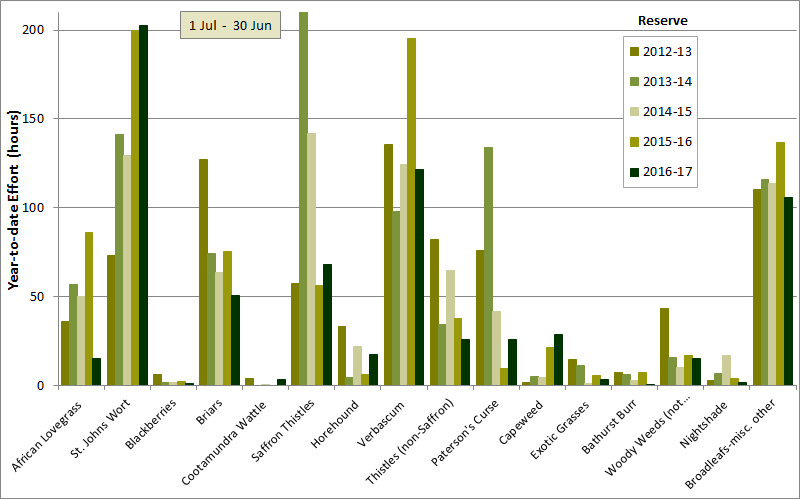
Comparison of effort for each weed type for the last five years
The chart to the left shows the amount of effort in the Reserve in each of the last five seasons for each of the weed types targeted. The comparison here is restricted to the Reserve because of the inconsistent weed control in the neighbouring paddocks over those years. Comparison of effort for the Reserve alone therefore provides a better indication of weeding effort required to control each weed type. To see the equivalent chart for the Reserve and neighbouring paddocks combined, open the comparison for the combined Reserve and neighbouring paddocks window.
While there are considerable differences in effort between seasons for some weed types, others are quite close. Notable is the continued decline in effort on briars suggesting that we are being successful in eradicating these (supported by a detailed analysis of a range of indicators). A similar decline can be seen for Saffron Thistles, the Thistles other than Saffron thistles grouping and woody weeds. Effort on Saffron thistles and Paterson's Curse peaked in 2013-14; while these could be seasonal effects, it is hoped that the decreased effort required since then is the result of our control effort rather than seasonal effects. Effort on St. John's Wort peaked in the 2016-17 season which was a very favourable year for it.
Although considerably less than the 320 h in 2011-12 (not shown) effort required for Verbascum varies from season to season. A detailed analysis suggests that this is the consequence of Verbascum prevalence being dependent on summer rainfall, but also that there is evidence that our weed control is having a permanent effect on Verbascum prevalence.
For a more detailed discussion of season to season differences, see season comparison page.
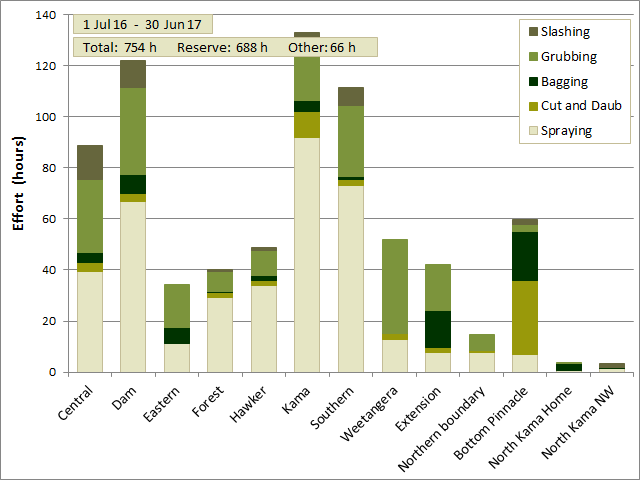
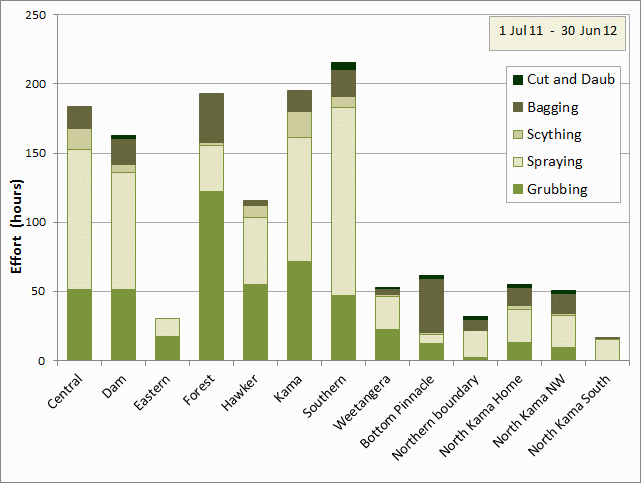
The chart to the left shows the total effort for each paddock, separated into the time spent applying each weed control method.
This chart is presented as total effort in each paddock. In order to judge relative levels of infestation by each weed type in different paddocks, the chart can also be viewed as the effort per hectare in each paddock for each weed type targeted. On that web page it can be seen, among other things, that Central, Dam, Kama and Southern paddocks generally received the most effort/ha (on the Reserve).
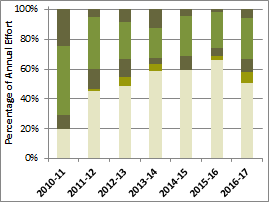
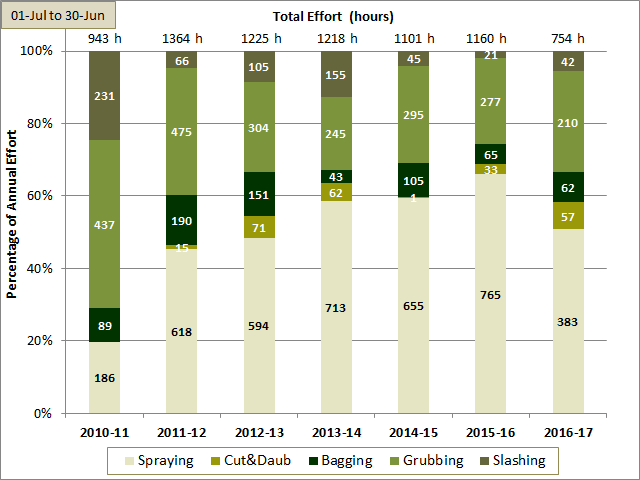
This chart shows the total effort in each year apportioned into the different control methods. The percentage effort is shown on the left hand axis and the absolute hours on the chart bars themselves.
The most obvious feature is the big increase in spraying after 2010-11, as we emphasised that as the preferable control method. The percentage of spraying declined slightly in the last season because of a decrease in available time of accredited volunteers but still represents more than 50% of effort. Until this season there was a gradual decrease in bagging after 2010-11 as the increased spraying allowed more effective control of weeds prior to maturity and a steady decrease in grubbing as a control method as we aim to minimise the soil disturbance causes by using this method. The percentages of both increased slightly in this season in response to the decline in spraying.