Friends of The Pinnacle   weeding effort  2020 - 2021  
  
home page what's on news


search tips advanced 
site search by freefind


An important aspect of the Weed Management Plan is monitoring and reporting on our interventions. This includes monitoring our weeding effort to know how our resources have been deployed, and to compare it with the requirements projected in the plan and effort in previous seasons.

Data on this page is for the season 1 July 2020 to 30 June 2021. Weeding effort for the current season, updated quarterly, can be found at weeding effort.

To view data from previous seasons, select the required season from the "Past effort" menu above, then select overview.


Tip: Hover mouse over chart thumbnail to see full size chart.

Total Effort


The chart shows the total effort for each of the last five seasons, divided into the time spent in the Reserve, Bottom Pinnacle and North Kama paddocks.

Between 1 July 2020 and 30 June 2021, the total effort deployed on weed control was 802 hours. This was 17% (115 h) more than last season, and the largest total for the last 5 seasons, but still 19% less than the average of all the previous seasons in our records.

The amount of time spent on the Reserve* itself (99% of the total) was 25% more than last season.

[* Note: effort for the Reserve includes effort in the 2016 Extension for all seasons.]

Compared with the average for the previous 10 seasons the total effort was 19% less but the effort spent on the Reserve alone was only 3% less. This is because with our reduced resources we have prioritised the Reserve and had to abandon a great deal of weed control in the adjacent paddocks.

Despite the increased effort this season we struggled to control many of the usual invasive weed targets, notably St. John's Wort and Verbascum.

Another feature of the effort is the increasing proportion spent in Weetangera paddock (38% of total effort on the Reserve this season), as examined in more detail below. For this reason it has been separated out from the rest of the Reserve for many of the analyses here.


Effort for different weed types


This chart shows the total effort for each weed type across all paddocks.

This chart shows the total effort for each weed type and how that was distributed. The largest effort was spent on miscellaneous Broadleaf Weeds* (215 h, 79% in the Weetangera paddock). The next most effort was for Verbascum (149 h), followed by St. John's Wort (116 h) and Saffron Thistles (109 h). Together these accounted for 74% of total effort.

[*miscellaneous Broadleaf Weeds includes Hoary Mustard, Prickly Lettuce, Nightshade, Tragopogon, Plantain, various 'flatweeds', Paddy melon and Sorrel which are largely rated as weeds of minor concern.]

Reserve
Misc. Broadleaf weeds 27%
Verbascum 19%
St. John's Wort  15%
Saffron Thistles 13%
Capeweed 8%
Exotic Grasses* 7%
Other Thistles 5%
Briars  2%
All other 4%

* Exotic Grasses includes African Lovegrass, Serrated Tussock as well as the many less invasive species

The percentage of total effort for each of the top 8 weed types (and the rest) on the Reserve is shown in the table.

Changes in the percentage of effort compared with last season were small, the largest being a doubling of effort on Capeweed and Exotic grasses; this was primarily effort in Weetangera paddock as shown in the chart above.


The amount of effort spent on each weed type in each paddock can be seen at the following page: relative prevalence of each weed type in each paddock.


This chart shows the comparison of effort for each weed type targeted in the Reserve across the last five seasons.

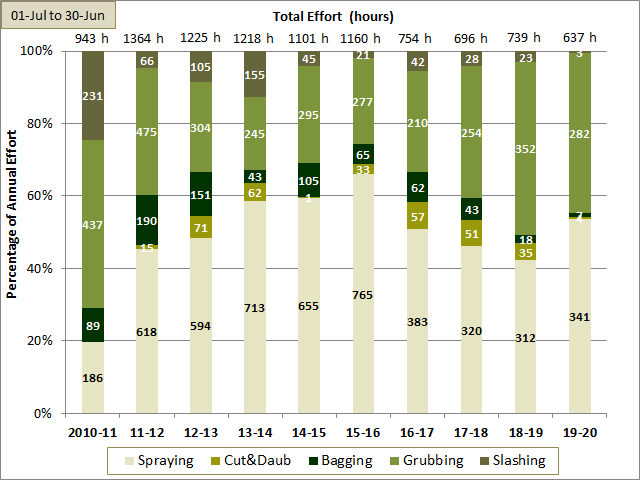
Comparison of effort for each weed type for the last five seasons

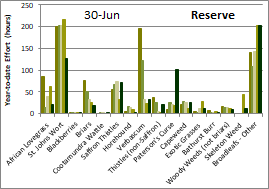
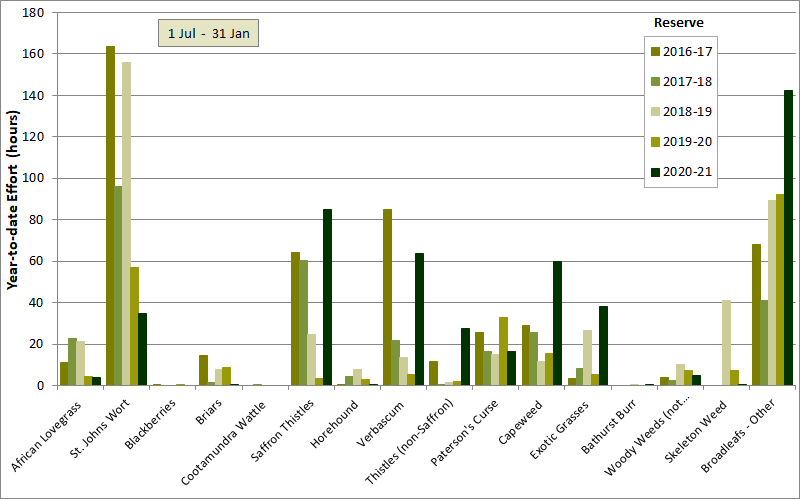
This chart shows the amount of effort in the Reserve in each of the last five seasons for each of the weed types targeted. The comparison here is restricted to the Reserve because of the inconsistent weed control in the neighbouring paddocks over those seasons. Comparison of effort for the Reserve alone therefore provides a better indication of weeding effort required to control each weed type. The equivalent chart for the whole area can be seen by clicking the following link: comparison for the combined Reserve and neighbouring paddocks.

While there are considerable differences in effort between seasons for some weed types, others are quite close. Consistent trends can be seen in the decline of effort required for briars and for other woody weeds suggesting that we are being successful in eradicating these.

Briars, which have been closely monitored, decreased steadily from an average density across the Reserve of 44 briars/ha in 2012-13 to 1.1 briars/ha in 2020-21 (see the detailed analysis for a range of indicators of briar eradication success).

Effort on Verbascum peaked in 2015-16 and then tailed off until the 2020-21 season. It is believed that this is strongly linked to rainfall. A detailed analysis up to 2019-20 suggested Verbascum prevalence was primarily dependent on summer rainfall, but also that there is evidence that our weed control was having a permanent effect on Verbascum prevalence. This analysis will need to be reviewed in light of the 2020-21 season.

By contrast, effort on the category of miscellaneous broadleaf weeds shows no sign of decreasing, though this is in part due to the deployment to this category of resources previously used on other weed types.

Otherwise, effort is quite variable from season to season depending on seasonal conditions and available effort.

For a more detailed discussion of season to season differences, see season comparison page.


Effort in different paddocks


The chart shows the total effort for each paddock, divided into the time spent using different weed control methods.

The chart to the left shows the total effort per hectare for each paddock. As foreshadowed in the overview above, the effort in Weetangera paddock this season is quite disproportionate to it's area (23 h/ha compared with 3.5 h/ha for the rest of the Reserve combined). As shown in the weed type chart above this effort has largely gone into removing miscellaneous broadleaf weeds rated as a minor risk (see weed risk ratings).

Otherwise, the chart shows that Kama, Southern and Central paddocks continue to be the areas that require the most effort to control invasive weeds.


The chart shows the total effort in each year, divided into the time spent using different weed control methods.

Effort spent on different control methods

This chart shows the total effort in each season apportioned into the different control methods. The percentage effort is shown on the left hand axis and the absolute hours on the chart bars themselves.

Spraying has dipped below 40% of effort since our first full season of spraying in 2011-12, largely because of the unavailability of people to do the spraying. This is also reflected in the dramatic increase in bagging in 2020-21. Our inability to deploy enough spraying capacity in an intense season meant playing catch-up by bagging seed heads where we hadn't been able to spray soon enough.


The chart shows the total effort for each paddock, divided into the time spent grubbing and pulling weeds and that spent spraying.


Summary of web pages showing more detailed analyses
of weeding effort
total effort for each weed type compared for the last 5 seasons
effort per hectare in each paddock for each weed type targeted
effort in each paddock for each weed type targeted
effort for each weed type in each paddock (via hover map)
monthly effort for each weed type compared for the last 5 seasons
monthly effort for each weed type compared for the all seasons


© Friends of The Pinnacle