Note: This page has not been optimised for small screens
Most-recent fotpin News
An important aspect of the Weed Management Plan is monitoring and reporting on our interventions. This includes monitoring our weeding effort to know how our resources have been deployed, and to compare it with the requirements projected in the plan and effort in previous years.
Data on this page is for the year 1 July 2019 to 30 June 2020.
Weeding effort for the current season, updated monthly, can be found at weeding effort.
To view data from previous seasons, select the required season from the "Past effort" menu above, then select overview.
Tip: Hover mouse over chart thumbnail to see full size chart.
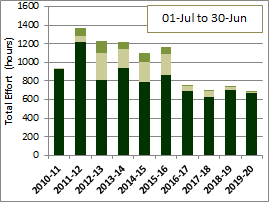
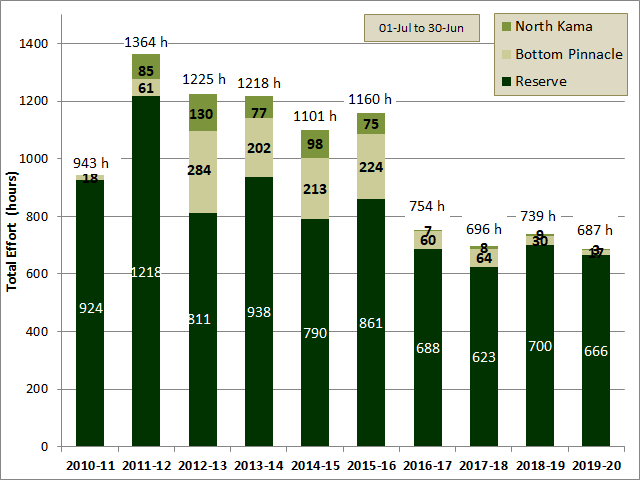
Between 1 July 2019 and 30 June 2020, the total amount of effort deployed on weed control was 687 hours. This was 7% (52 h) less than last season, and the smallest total for the 10 years of records. The amount of time spent on the Reserve* itself (97% of the total) was 5% less than last season, and the second smallest on record. This comparatively low effort reflects the effect of the very dry first 7 months of the season on weed growth, followed by periods where volunteering was restricted by bushfire smoke and COVID-19 regulations..
[*Note: effort for the Reserve includes effort in the 2016 Extension for all seasons.]
Compared with the average for the previous 9 seasons the total effort was 33% less but the effort spent on the Reserve alone was only 21% less. This is because with our reduced resources we have prioritised the Reserve and had to abandon a great deal of weed control in the adjacent paddocks.
On the other hand, effort for 2019-20 is comparable with that for the previous 3 seasons (2016 to 2019) (only 1% less for the Reserve and 6% less for the whole area.
Despite the reduced effort in the last four seasons, the major target weeds on the Reserve have been controlled as effectively as in previous seasons, in part because effort in adjacent paddocks has been reduced and focussed instead on the Reserve and in part because of our increased efficiency as a result of ever-improving mapping of where each weed type is located. In addition we are slowly having a measurable, lasting impact on weed infestation for a number of weed types, reducing the effort required from year to year.
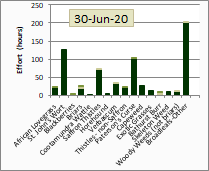
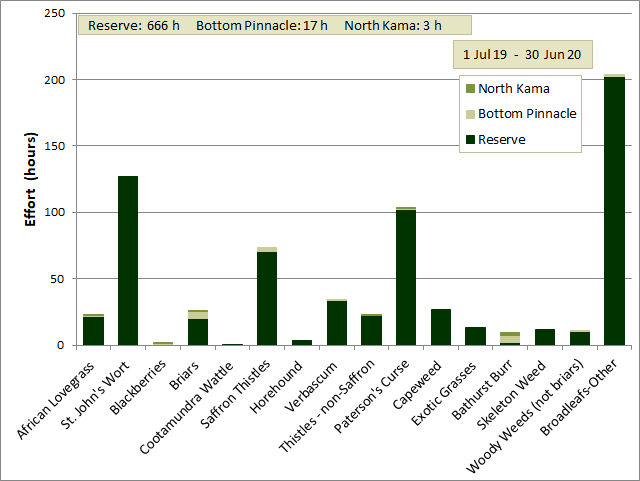
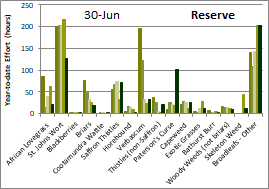
This chart shows the total effort for each weed type and how that was distributed between the Reserve and neighbouring paddocks. The largest effort was spent on miscellaneous Broadleaf Weeds* (204 h, 99.5% on the Reserve). The next most effort was for St. John's Wort (127 h, all on the Reserve), followed by Paterson's Curse (103 h, 99% on the Reserve), Saffron Thistles (73 h, 96% on the Reserve) and Verbascum (34 h, 99% on the Reserve). Effort on no other weed type was greater than 27 h.
*miscellaneous Broadleaf Weeds includes Hoary Mustard, Prickly Lettuce, Nightshade, Tragopogon, Plantain, Flatweeds, Paddymelon and Sorrel.
Reserve
Misc. Broadleaf weeds
30%
St. John's Wort
19%
Paterson's Curse
15%
Saffron Thistles
11%
Verbascum
5%
Capeweed
4%
Other Thistles
3%
African Lovegrass
3%
Briars
3%
Other
7%
The percentage of total effort for each of the top ten weed types (and the rest) on the Reserve is shown in the table.
Weeds for which there were large increases in effort compared with last season because of the wet, warm autumn favouring germination and growth:
Paterson's Curse - 84 h (460%) more
Saffron Thistles - 38 h (120%) more
Thistles other than Saffron Thistles - 19 h (640%) more
Capeweed - 15 h (130%) more
Verbascum - 9 h (37%) more
Weeds for which there were large decreases in effort compared with last season:
Comparison of effort for each weed type for the last five years
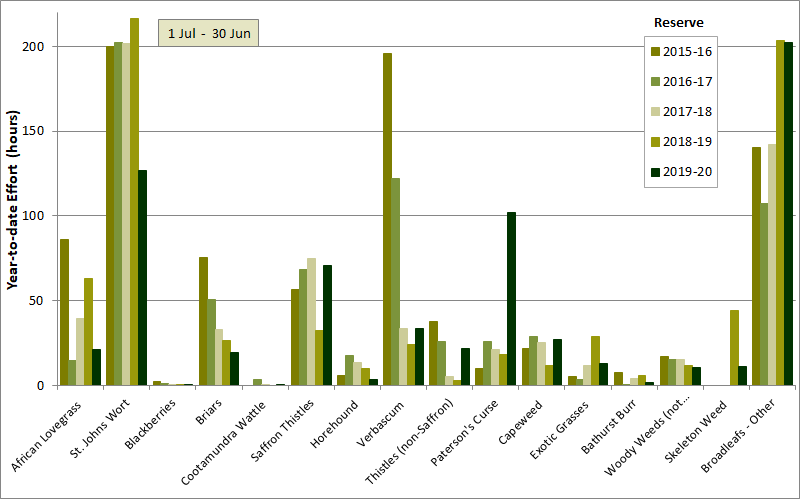
This chart shows the amount of effort in the Reserve in each of the last five seasons for each of the weed types targeted. The comparison here is restricted to the Reserve because of the inconsistent weed control in the neighbouring paddocks over those years. Comparison of effort for the Reserve alone therefore provides a better indication of weeding effort required to control each weed type. To see the equivalent chart for the Reserve and neighbouring paddocks combined, open the comparison for the combined Reserve and neighbouring paddocks window.
While there are considerable differences in effort between seasons for some weed types, others are quite close. Consistent trends can be seen in the decline of effort required for briars and for other woody weeds suggesting that we are being successful in eradicating these (supported by a detailed analysis for briars of a range of indicators). Effort on Verbascum peaked in 2015-16. A detailed analysis suggests that this is the consequence of Verbascum prevalence being dependent on summer rainfall, but also that there is evidence that our weed control is having a permanent effect on Verbascum prevalence.
By contrast, effort on the category of miscellaneous broadleaf weeds shows no sign of decreasing.
Otherwise, effort is quite variable from years to year depending on seasonal conditions and available effort.
For a more detailed discussion of season to season differences, see season comparison page.
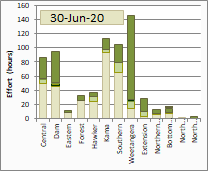
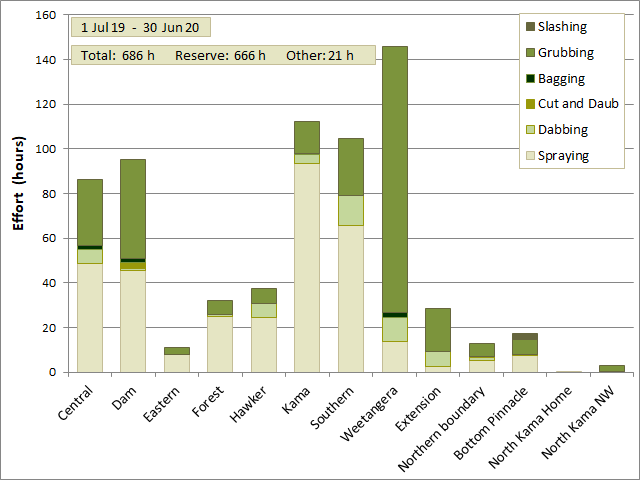
The chart to the left shows the total effort for each paddock, separated into the time spent applying each weed control method.
This chart is presented as total effort in each paddock. In order to judge relative levels of infestation by each weed type in different paddocks, the chart can also be viewed as the effort per hectare in each paddock for each weed type targeted. On that web page it can be seen, among other things, that Central, Dam, Kama and Southern paddocks generally received the most effort/ha (on the Reserve).
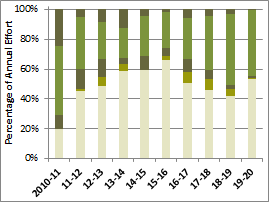
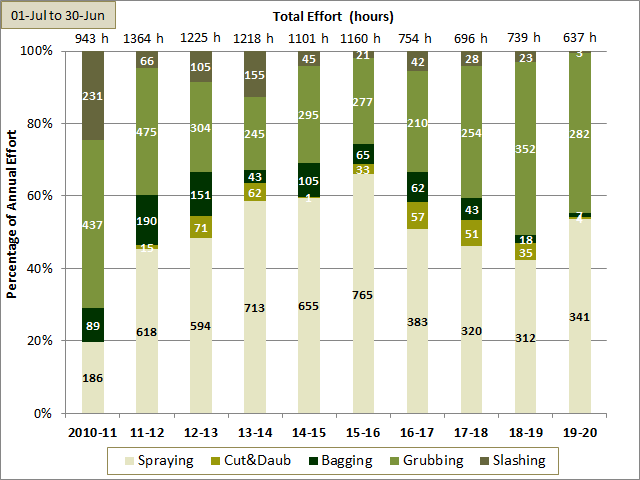
This chart shows the total effort in each year apportioned into the different control methods. The percentage effort is shown on the left hand axis and the absolute hours on the chart bars themselves.
The most obvious feature is that since 2010-11 the dominant method has been spraying in most seasons, as we emphasised that as the preferable control method. Overall there has been a decrease in bagging since 2010-11 as the increased spraying allowed more effective control of weeds prior to maturity. For the first few years there was a steady decrease in grubbing as a control method as we aimed to minimise the soil disturbance causes by using this method, but its percentage has increased again in recent years though the hours of effort remains much smaller than in 2010-11.