Note: This page has not been optimised for small screens
Most-recent fotpin News
An important aspect of the Weed Management Plan is monitoring and reporting on our interventions. This includes monitoring our weeding effort to know how our resources have been deployed, and to compare it with the requirements projected in the plan and effort in previous seasons.
Data on this page is for the season 1 July 2021 to 30 June 2022.
Weeding effort for the current season, updated quarterly, can be found at weeding effort.
To view data from previous seasons, select the required season from the "Past effort" menu above, then select overview.
Tip: Hover mouse over chart thumbnail to see full size chart.
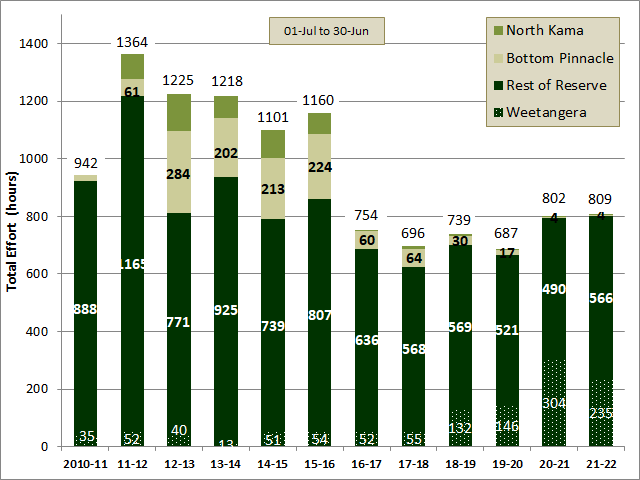
Between 1 July 2021 and 30 June 2022, the total effort deployed on weed control was 809 hours. This was almost exactly the same as last season (802 h) and the largest total for the last 6 seasons.
The amount of time spent on the Reserve* itself (99% of the total) was also the same as last season.
[*Note: effort for the Reserve includes effort in the 2016 Extension (Kama Link paddock) for all seasons.]
Compared with the average for the previous 11 seasons the total effort was 17% less but the effort spent on the Reserve alone was only 2% less. This is because with our reduced resources we have prioritised the Reserve and had to abandon a great deal of weed control in the adjacent paddocks.
Despite the steady effort this season we struggled to control many of the usual invasive weed targets, notably St. John's Wort and Verbascum, because of the high rainfall encouraging weed growth.
Another feature of the effort in recent seasons has been the increasing proportion spent in Weetangera paddock (up to 38% of total effort), as examined in more detail below. For this reason it has been separated out from the rest of the Reserve for many of the analyses here.
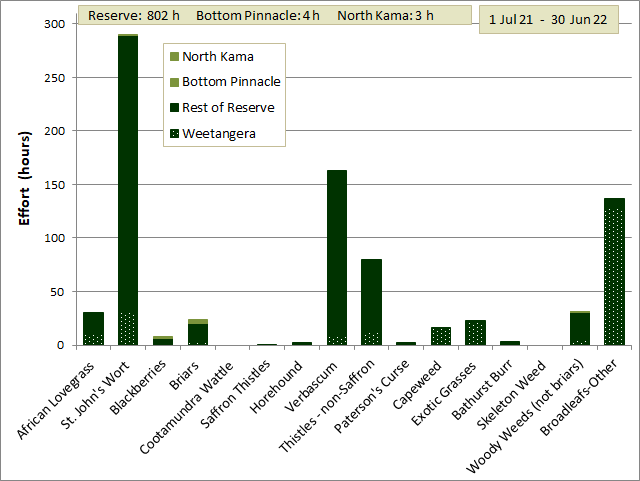
This chart shows the total effort for each weed type. The largest effort was spent on St. John's Wort (290 h). The next most effort was for Verbascum (163 h) followed by miscellaneous Broadleaf Weeds* (137 h, 94% in the Weetangera paddock) and Thistles other than Saffron Thistles (80 h). Together these accounted for 83% of total effort.
[*miscellaneous Broadleaf Weeds includes Hoary Mustard, Prickly Lettuce, Nightshade, Tragopogon, Plantain, various 'flatweeds', Paddy melon and Sorrel which are largely rated as weeds of minor concern.]
Reserve
St. John's Wort
36%
Verbascum
20%
Misc. Broadleaf weeds
17%
Other Thistles
10%
Exotic Grasses*
7%
Woody weeds (not briars)
4%
Briars and Blackberries
3%
All other
4%
* Exotic Grasses includes African Lovegrass, Serrated Tussock as well as the many less invasive species
The percentage of total effort for each of the top 7 weed types (and the rest) on the Reserve is shown in the table.
There were significant changes in how our effort was apportioned compared with last season.
Effort on St. John's Wort more than doubled, as a result on our focussing on more intensively spraying in priority areas (based on native species diversity). Effort on Woody weeds including Briars and Blackberries almost doubled with successive wet seasons stimulating their germination and growth.
In contrast, the proportion of effort required for Saffron Thistles was only 1% compared with 13% last season because their density was comparatively very low. In contrast, effort on other thistles increased with their increasing prevalence. Effort on Miscellaneous broadleaf weeds decreased by a third as we focussed on higher priority weeds
Effort on Verbascum and Exotic grasses was very similar to last season.
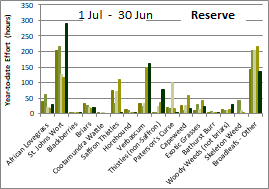
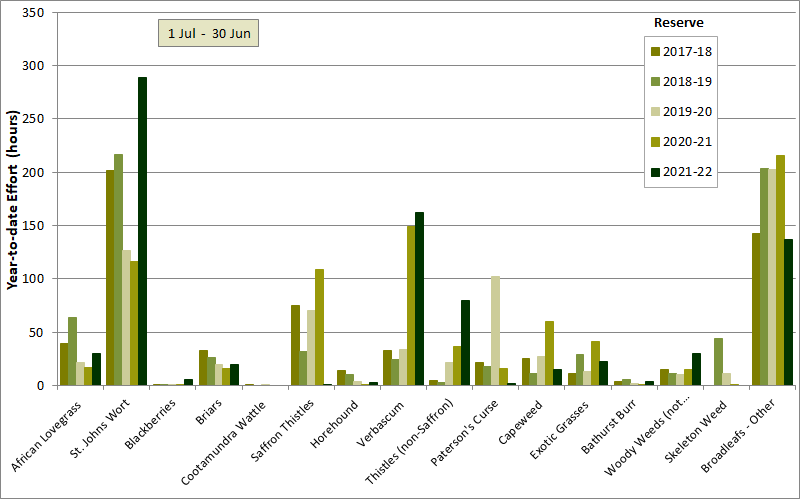
Comparison of effort for each weed type for the last five seasons
This chart shows the amount of effort in the Reserve in each of the last five seasons for each of the weed types targeted. The comparison here is restricted to the Reserve because of the inconsistent weed control in the neighbouring paddocks over those seasons. The equivalent chart for the whole area can be seen by clicking the following link: comparison for the combined Reserve and neighbouring paddocks.
The differences between seasons since the 2019-20 season do not reflect the effort required to control each weed type as they did in previous seasons because we have not had the resources to maintain treatment of each weed type across the whole reserve. The exceptions are Verbascum, Briars, Blackberries and other Woody weeds.
Effort on Verbascum peaked in 2015-16 and then tailed off until the 2021-22 season. It is believed that this is strongly linked to rainfall. A detailed analysis up to 2020-21 suggests Verbascum prevalence is primarily dependent on summer rainfall, but also that other factor(s) affect it. This analysis will need to be reviewed in light of the 2021-22 season.
Briars, which have been closely monitored, decreased steadily from an average density across the Reserve of 44 briars/ha in 2012-13 to an average of 2.3 briars/ha between 2029-20 and 2021-22, despite a bounce in numbers following the favourable seasons in 2021 and 2022. (see the detailed analysis for a range of indicators of briar eradication success).
Otherwise, effort is quite variable from season to season depending on seasonal conditions and available effort.
For a more detailed discussion of season to season differences, see season comparison page.
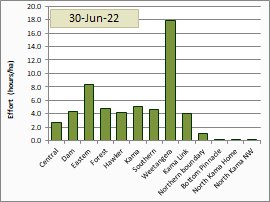
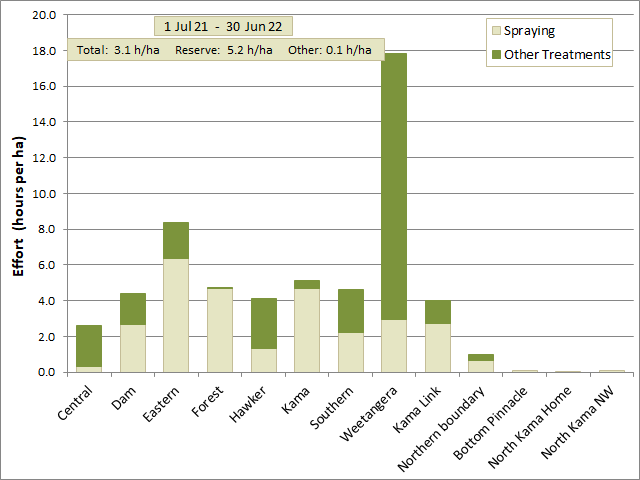
The chart to the left shows the total effort per hectare for each paddock. As foreshadowed in the overview above, the effort in Weetangera paddock this season is quite disproportionate to it's area (18 h/ha compared with 4.7 h/ha for the rest of the Reserve combined). As shown in the weed type chart above this effort has largely gone into removing miscellaneous broadleaf weeds rated as a minor risk (see weed risk ratings). Effort in Eastern paddock was quite high this season with a lot of work being done to control St. John's Wort. Effort in Dam, Forest, Hawker, Kama and Kama Link paddocks was about the same reflecting the prioritisation of treatment of St. John's Wort and Verbascum in those paddocks. Southern paddock was similar where some prioritisation also occurred.
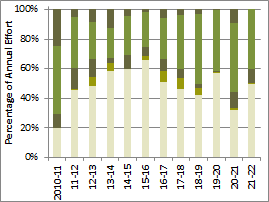
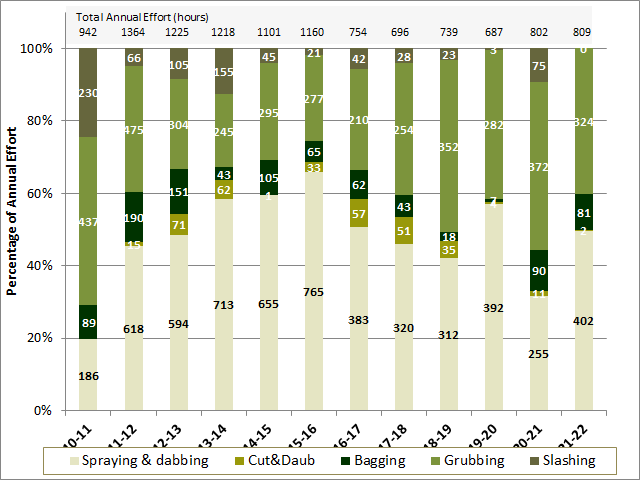
This chart shows the total effort in each season apportioned into the different control methods. The percentage effort is shown on the left hand axis and the absolute hours on the chart bars themselves.
Spraying dipped below 40% of effort in 2011-12 or the first time since our first full season of spraying, but rebounded in 2021-22.